 Blue Leaf Labs
We’ve all experienced increasingly hotter summers and record heat waves over the last few years. Wildfires have devastated large parts of California, with a thick pall of smoke that turned the sky orange for days hundreds of miles away from where it started. I noticed that even within parts of the Bay Area, the impact isn’t the same everywhere; some neighborhoods stayed cooler and clearer, while others suffered worse air and higher heat. It made me wonder: can we measure that inequality directly and tie it to a measure of social equity?
Watch a three-minute video of HeatShield in action:
What HeatShield does
HeatShield is a data-driven Python application designed to predict, map, and ultimately prevent urban heat risk for vulnerable communities. In it, I integrate multiple types of environmental and social data into a single model. HeatShield downloads publicly available measurements of air quality, surface temperature, wildfire activity, and smoke coverage, and then merges them with U.S. Census tract-level demographic and socioeconomic indicators, including income distribution and age. I then align these to a uniform 3-kilometer grid across the state of California, enabling consistent comparison of conditions in both urban and rural settings.
The build got hairy fast
This started simple, but quickly turned hairy. Among the challenges:
- Each dataset had a different level of geographic density, and I spent hours attempting to map, match, and merge them into a unified view.
- Time dimensions were daily, hourly, or even irregular, and had to be carefully aligned.
- I started with a 750 m grid, but that gave me 3 million data points and overwhelmed my laptop. I had to increase the grid to 3 km.
- I began in a Google Colab notebook but quickly ran into space constraints. I had to pivot to running it locally, which required setting up the Python environment from scratch.
What the data shows
But finally, some interesting insights.
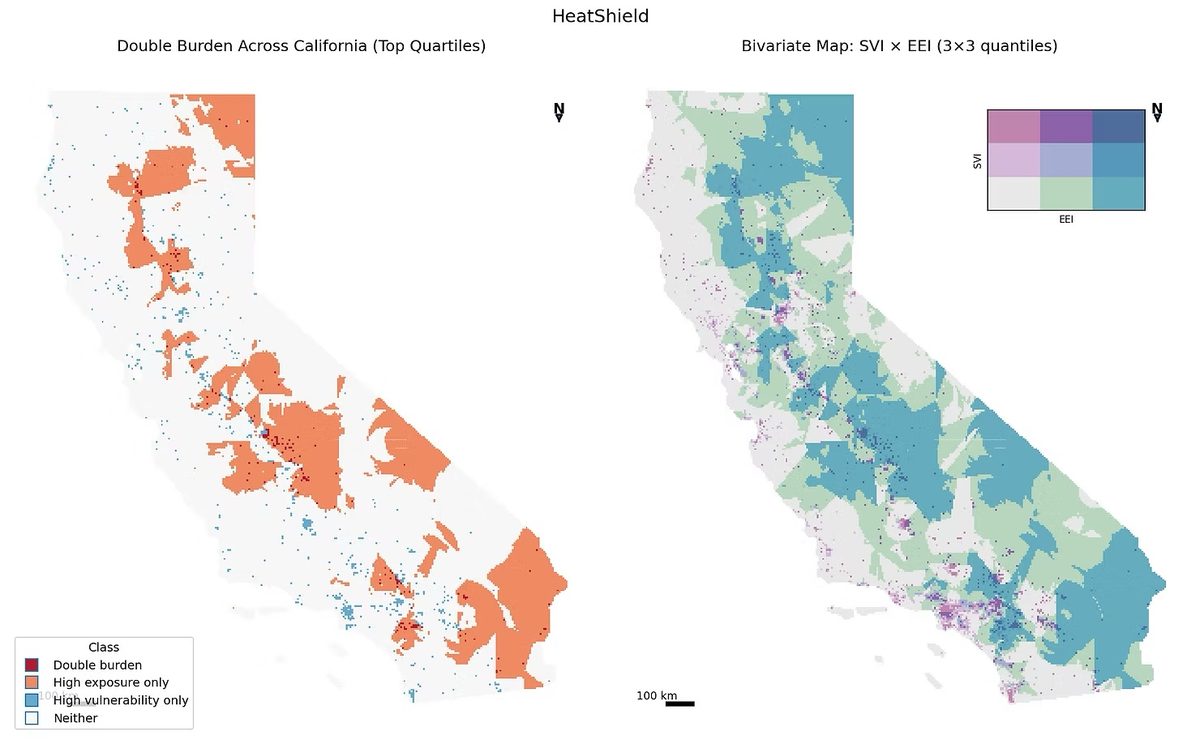
This map shows the double-burden areas: places high on both vulnerability and exposure. You can see clear clusters in California’s Central Valley and southern desert, regions with both extreme heat and high poverty. The bivariate map on the right visualizes all combinations: blue means low risk, and red-purple marks the highest combined stress, the same places identified as double-burdened.
The communities most at risk
Finally, let’s look at the top five percent of communities suffering the worst mix of heat, smoke, and inequality. These are the areas that policymakers need to focus on.
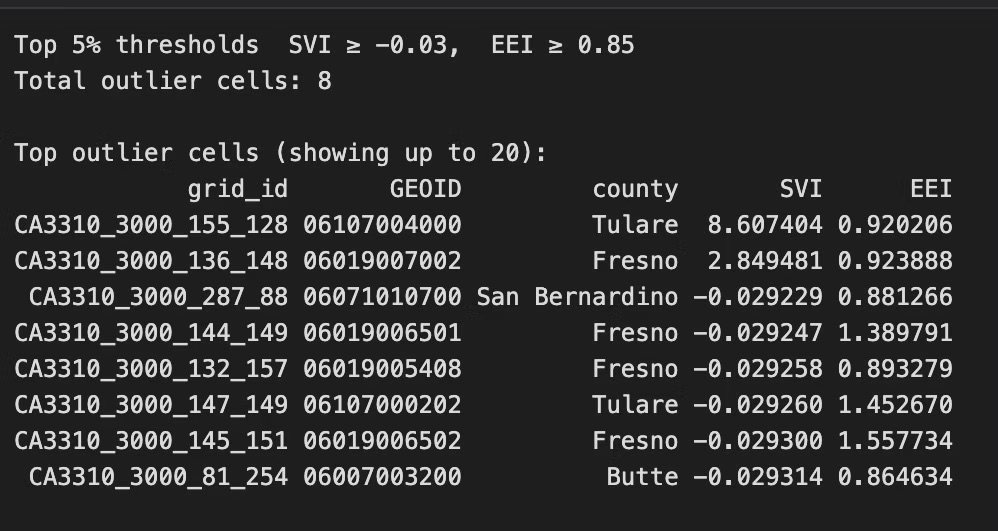
HeatShield turns complex environmental data into insight that policymakers can act on. It’s about making equity visible, and helping protect the people most at risk.
Tools
- Python 3.11, Jupyter Notebook
- Pandas, GeoPandas, Matplotlib, and others
- Data from AQS, AirNow, NOAA, and the U.S. Census
- Mapped to a 3-km grid that covers all of California
Full source code is available on GitHub.